amos
| Version |   |
| Status |    |
| Documentation |  |
| Tools |         |
| Compatibility |     |
| Stats |      |
What is amos?

Automated Modeling for Open Scholarship.
Like the Rocinante's
mechanic in The Expanse, amos handles the dirty jobs of a data science
project: cleaning, describing, splitting, preprocessing, modeling, evaluating,
and drawing. It is designed for academic research, where a result has to be
explained and reproduced.
You describe a study in a plain settings file (or a Python dict). amos
builds the workflow with chrisjen,
runs it on your data, compares every combination of the methods you list, and
records everything needed to reproduce the result.
Why use amos?

Accessible
amos is accessible to researchers at all levels. It uses one vocabulary for every stage of a
project. A project is made of workers (its stages), which use
techniques (the actual methods), sometimes organized in steps. The
settings file only names things, so it doubles as a readable description of
your methods:
The stages are only a convention: any technique can be used in any worker, and
you can name your workers whatever you like. And, any step can include none, which tests
whether a technique changes the result versus doing nothing at all.
Reproducible

Open scholarship means that others can check your work. amos helps by:
- Passing one seed to every tool that takes a
random_state, so a project yields the same result every time. - Applying a project to a copy of your data, so running it twice gives the same answer and your data is never changed.
- Keeping a history of every technique that was applied, with the exact tool and parameters it used.
- Isolating training and testing data. Every scaler, encoder, imputer, and sampler is fitted to the training rows and then applied to the test rows, so nothing leaks from the test set.
- All settings and parameters can be implemented through a single settings file that will produce the same results on any computer.
Flexible
amos wraps the major Python data science packages behind one interface, so you can compare their methods side by side without learning each package's quirks:
| Package | What amos uses it for |
|---|---|
| scikit-learn | Splitting, imputing, scaling, feature selection, models, cross-validation, metrics, and permutation importance. |
| category_encoders and skrub | Target, weight of evidence, and a dozen other data encoders. |
| imbalanced-learn | SMOTE and other ways to balance the classes of the training rows. |
| xgboost, lightgbm, and catboost | Gradient boosting. |
| InterpretML | Explainable boosting machines: accurate models whose every effect can be shown. |
| TabPFN | A pretrained model that is most accurate on small data. |
| Optuna | Hyperparameter searches that learn from each try. |
| statsmodels and pyfixest | Regressions with standard errors, p-values, and confidence intervals: least squares, generalized linear, quantile, robust, mixed, and GEE models; models of counts, of two or more classes, and of ordered classes; fixed effects and clustered standard errors; and principal component and factor analysis of the features. Survival analysis: Kaplan-Meier curves and Cox regression of the time until an event. |
| DoubleML, DoWhy, causalml, and tigramite | Causal inference: the effects of a treatment, estimated with double machine learning, regression, matching, weighting, instruments, regression discontinuities, and meta-learners, and causal discovery in time series. |
| fairlearn | Fairness metrics that compare a model across groups. |
| MAPIE | Conformal prediction: intervals and sets with a known rate of coverage. |
| shap and eli5 | Explaining models with SHAP values (and shap's plots of them) and weights. |
| matplotlib, seaborn, and SciencePlots | Figures and other visualizations, in the style of a scientific journal (Nature's, by default) and with colors that people with color blindness can tell apart. |
| great_tables and python-docx | Scorecards as HTML tables and Word documents. |
Robust and Transparent
A result that depends on one arbitrary choice of preprocessing or model is
fragile. The experiment design tries every combination of the techniques
you list for each step and reports how each one did, so readers can see that
your conclusions are robust (or not). The critic's scorecard puts every
combination side by side, on every metric, in a table (as
csv, Markdown, LaTeX, HTML, Word, or an image).
Name the columns that identify groups as groups, and amos keeps them out of the model's
features while it uses them to check fairness across groups, to add fixed
effects and cluster standard errors, and to keep each group in one set when
it splits the data.
Extensible
Every technique is a small Python class that is added to a library as soon as
it is defined, so it can be named in settings right away. To wrap a tool that
amos does not include, name its import path:
import amos

transformer = amos.Transformer(
    name = "yeo_johnson", contents = "sklearn.preprocessing.PowerTransformer")
print(transformer.name)
# yeo_johnson
You can use any naming convention you like, but, by default, amos uses snakecase
of a class name as the default key for accessing it from the stored technique library.
Getting started
Requirements
amos requires Python 3.11 or later. It runs on Linux, macOS, and Windows. It
is built on chrisjen, numpy,
pandas, and scikit-learn, which are installed automatically.
Installation
To install amos, use pip:
The other packages that amos wraps are optional. A technique imports its
package only when it is used, and tells you which extra to install if the
package is missing. Install them all (except TabPFN) with pip install
amos[all], or choose:
| Extra | Installs | For |
|---|---|---|
boosting |
xgboost, lightgbm, catboost | Gradient boosting models. |
causal |
DoubleML (with rdrobust), tigramite, causalml (on Python 3.11 and 3.12), DoWhy (on Python 3.13 and later) | Inferers for causal inference, such as partially_linear, regression_discontinuity, propensity_matching, x_learner, and pcmci. |
encoders |
category_encoders, skrub | Target encoders, and encoders for text and dates. |
explain |
shap, eli5, InterpretML | shap_importance, the SHAP plots (such as shap_beeswarm), explain_weights, and explainable_boosting. |
fairness |
fairlearn | Fairness metrics and the fairness table. |
plots |
matplotlib, seaborn, SciencePlots | The artist's figures, and scorecards as images. |
polars |
Polars, pyarrow | Reading Polars data frames. |
sampling |
imbalanced-learn | Samplers such as smote. |
statistics |
statsmodels, pyfixest | ols, glm, logit_sm, fixest, and the other models with inference (such as poisson, probit, and mixedlm). |
survival |
statsmodels | cox, kaplan_meier, survival_curves, and concordance. |
tables |
great_tables | Scorecards as HTML tables. |
tuning |
Optuna | search = "optuna" for any model. |
uncertainty |
MAPIE | conformal intervals and sets. |
word |
python-docx | Scorecards as Word documents. |
tabpfn |
TabPFN | The tabpfn model. It needs PyTorch, which is large, so it is not part of all. |
Usage
Describe your study
Most users describe a study in a settings file. This is a study of the Wisconsin breast cancer data that uses every stage, as an ini file:
[general]
seed = 43
label = target

[cancer_project]
cancer_workers = wrangler, explorer, analyst, critic, artist

[wrangler]
techniques = drop_duplicates, drop_constant

[explorer]
techniques = summarize, missing_values, label_balance

[analyst]
design = experiment
criterion = roc_auc
steps = split, scale, sample, model
split_techniques = stratified
scale_techniques = standard, min_max
sample_techniques = none, smote
model_techniques = logit, random_forest, xgboost

[critic]
techniques = scorecard, confusion, permutation_importance

[artist]
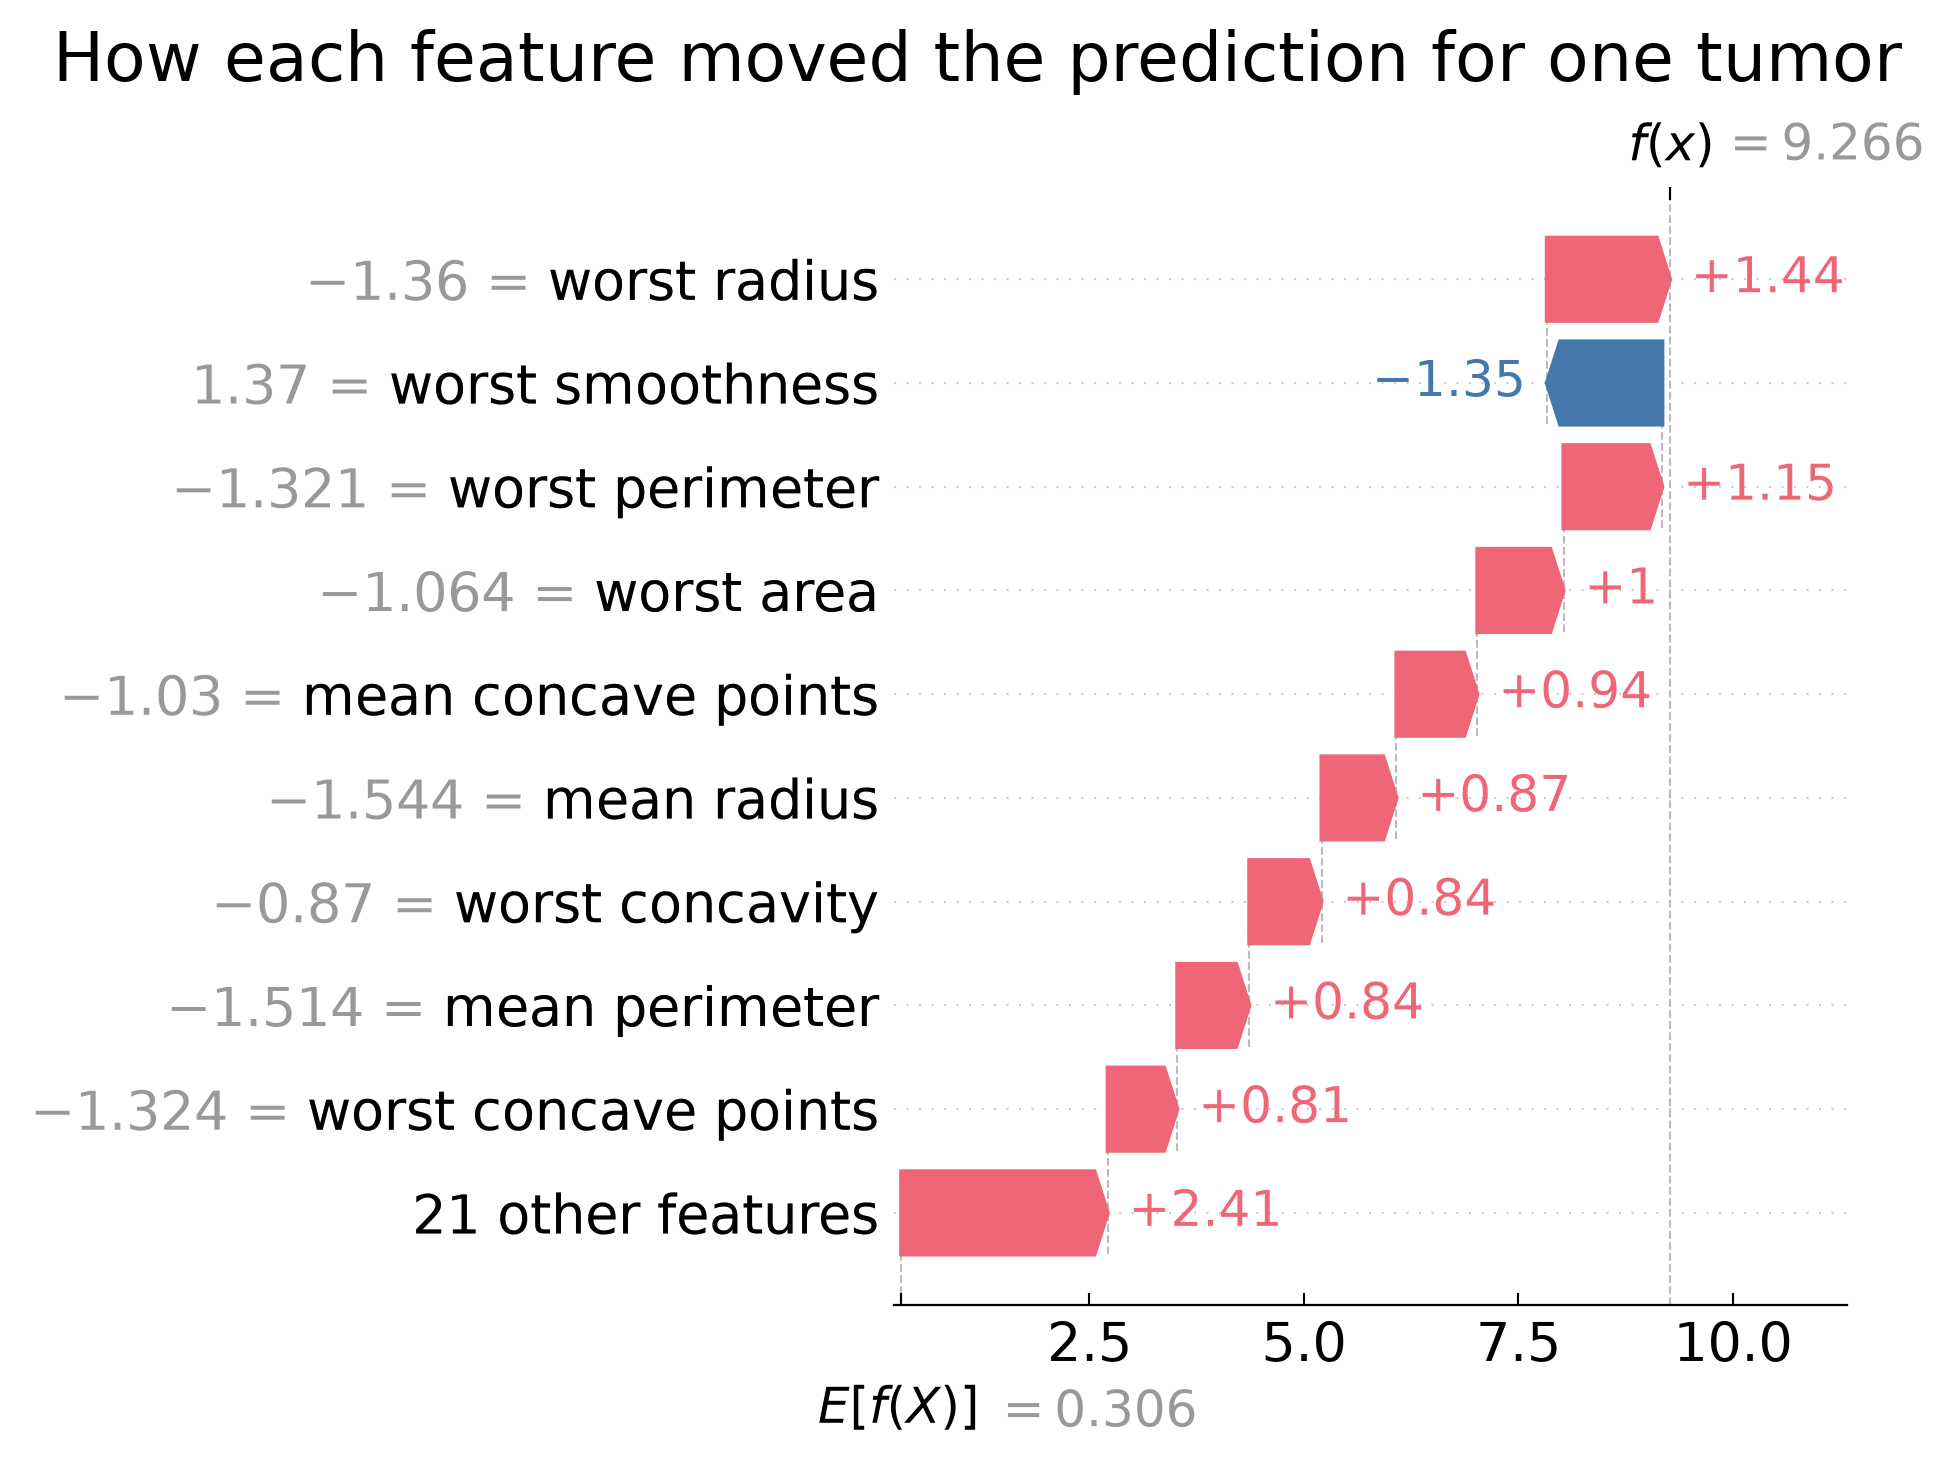
techniques = roc_curve, importance_plot, confusion_heatmap, shap_waterfall

[random_forest_parameters]
n_estimators = 100

[roc_curve_parameters]
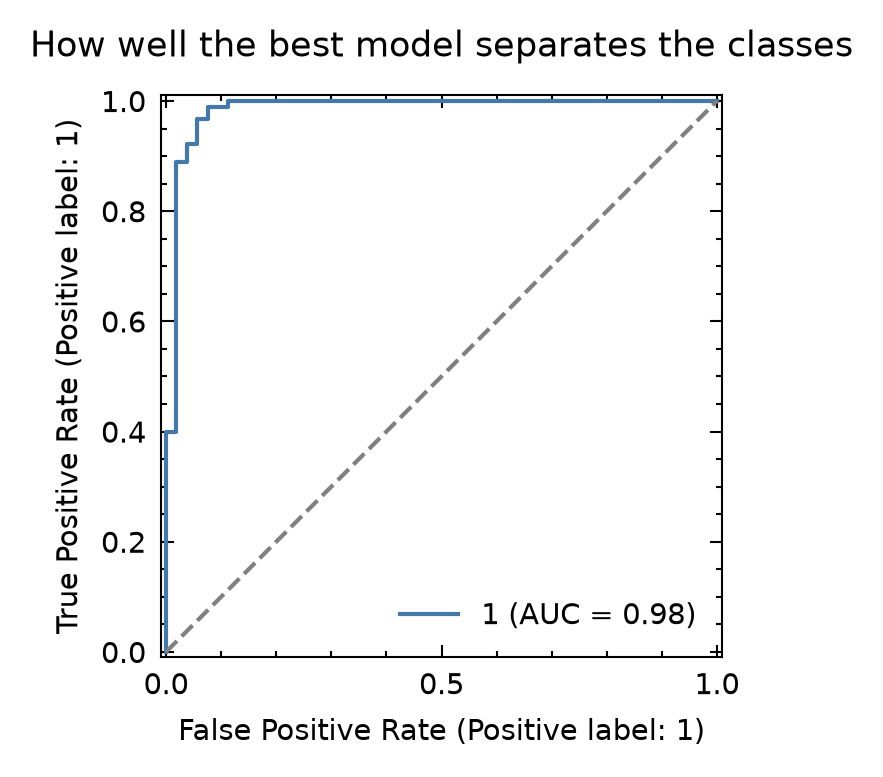
title = How well the best model separates the classes

[importance_plot_parameters]
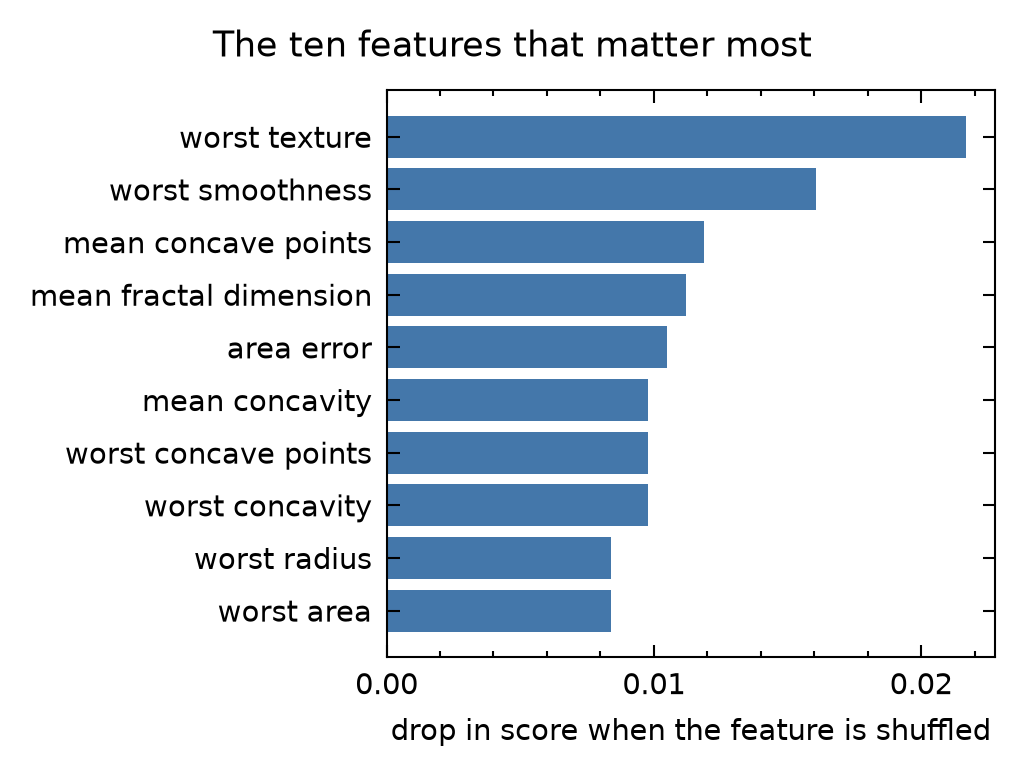
title = The ten features that matter most
limit = 10

[confusion_heatmap_parameters]
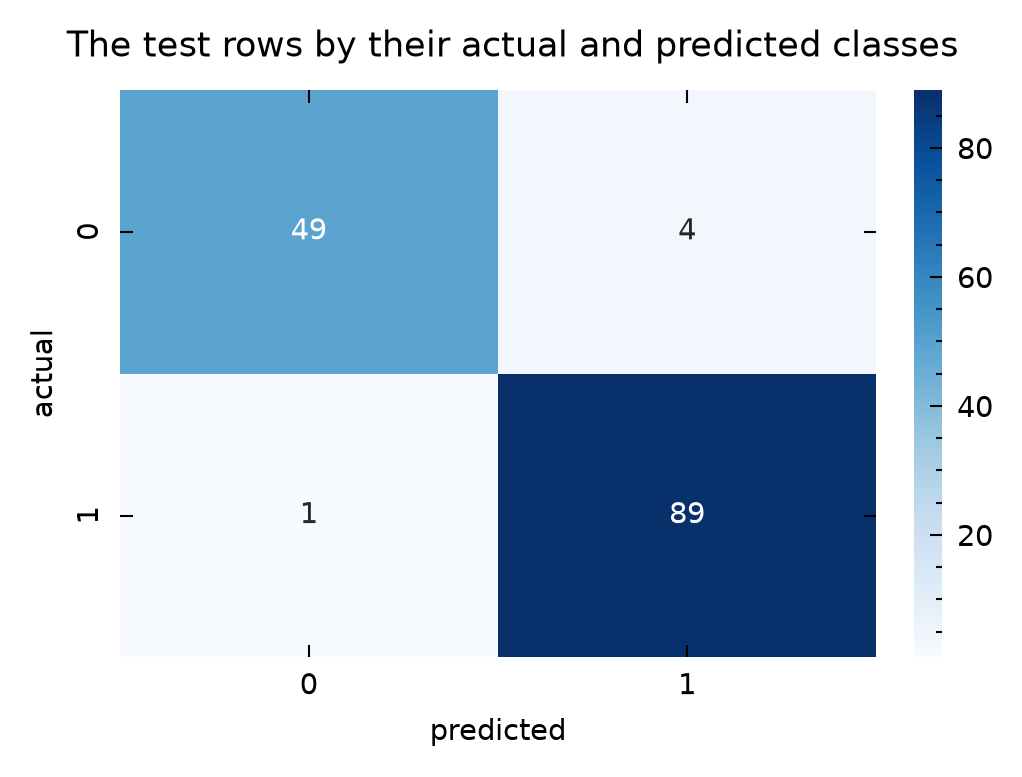
title = The test rows by their actual and predicted classes

[shap_waterfall_parameters]
title = How each feature moved the prediction for one tumor
The "general" section names the label (the column that models predict) and
the seed. The project section lists the workers. In the "analyst", each
{step}_techniques setting lists alternatives, and the experiment design
tries every combination: 2 scalers, 2 samplers, and 3 models (scikit-learn's
logistic regression, a random forest, and xgboost's gradient boosting) make
12 combinations. Parameters for any technique go in a {technique}_parameters
section. The study uses optional packages (imbalanced-learn for smote,
xgboost, shap for shap_waterfall, and matplotlib, seaborn, and SciencePlots
for the figures), which pip install amos[all] installs.
Run it
Pass the settings and the data (a pandas.DataFrame, a path to a data file,
or a scikit-learn dataset) to Project.create:
import sklearn.datasets

import amos

cancer = sklearn.datasets.load_breast_cancer(as_frame = True)
project = amos.Project.create("cancer.ini", item = cancer, id = "first_run")
result = project.result
print(result.metrics["roc_auc"] > 0.95)
# True
print(sorted(result.figures))
# ['confusion_heatmap', 'importance_plot', 'roc_curve', 'shap_waterfall']
The artist drew four figures, titled by their {technique}_parameters
sections. The ROC curve shows how well the best combination tells the two
kinds of tumors apart on the test rows it never learned from, and the
confusion heatmap counts the test rows that it classified rightly and
wrongly. The importance plot shows how much its score drops when each feature
is shuffled, which works for any model, and the SHAP waterfall shows how each
feature (after scaling) moved its prediction for one tumor:
The result includes a Dataset, the fitted model, its predictions,
metrics, tables, figures, and the history of every technique.
The settings can also say where the data comes from. A loader in the
wrangler (load_file, download, or openml) loads a data file, or
downloads one first, with the project's file manager, and then the project
needs no item. See loading
data.
Data rarely comes in one table of the right shape. Mergers (such as
merge_keys) add the columns of other tables to the rows that they match,
without ever adding or losing a row, and shapers (such as wide_to_long)
change what each row stands for. See merging
data and
reshaping
data.
Compare every branch
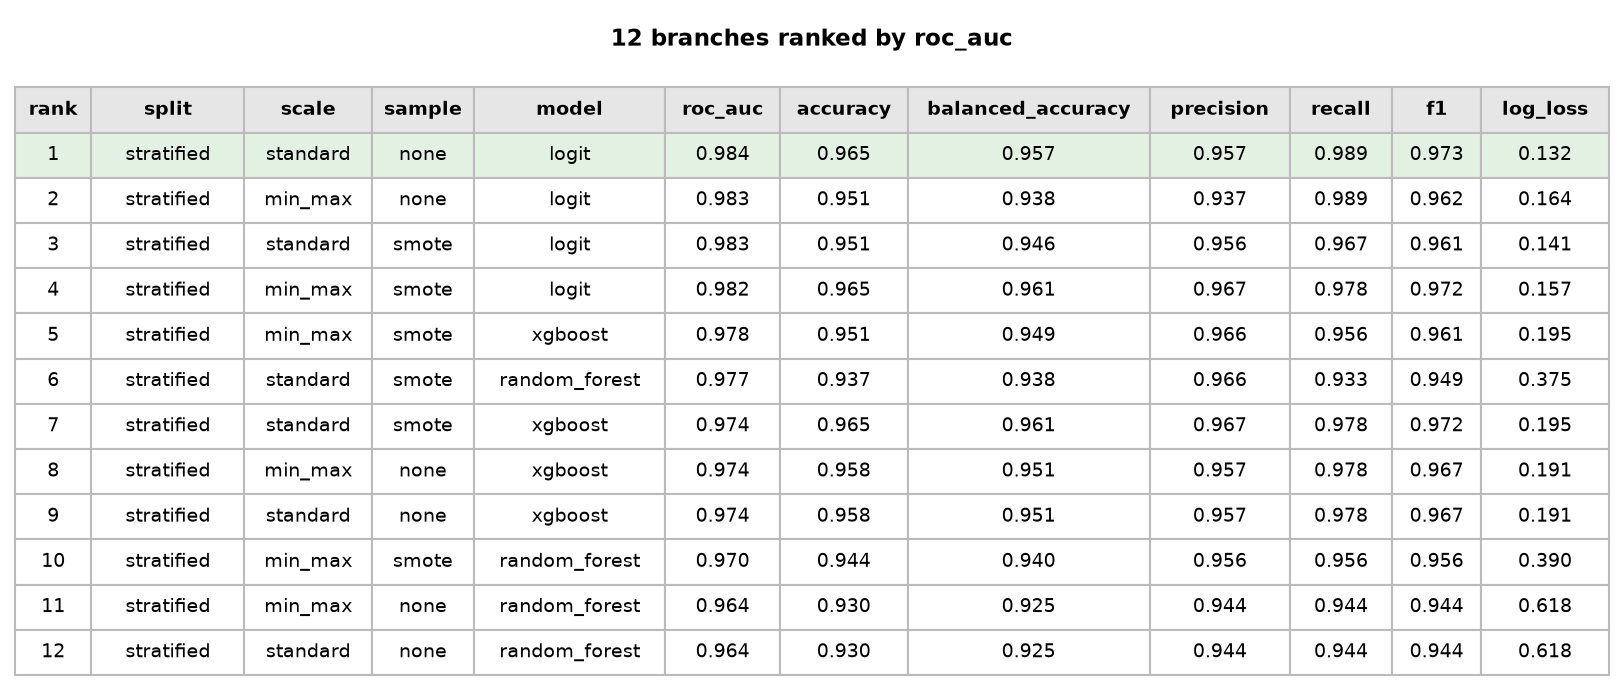
The critic's scorecard compares every branch of the analysis: each
combination of techniques that the experiment tried, ranked by the criterion,
with every standard metric for the task computed from that branch's own
predictions on the test rows. It can be saved as a csv file, a Markdown table,
a Word document, or an image:
scorecard = project.scorecard
print(len(scorecard.table), list(scorecard.table.columns[:5]))
# 12 ['rank', 'split', 'scale', 'sample', 'model']
scorecard.to_csv("scorecard.csv")
scorecard.to_markdown("scorecard.md")
scorecard.to_word("scorecard.docx")
scorecard.to_image("scorecard.png")
This is the scorecard of the study, saved as an image. The best branch is shaded:
Export the results
export saves everything needed to report and reproduce the results in a
folder named for the run.
There is much more to amos, including hyperparameter searches, statistical
inference with statsmodels, every technique and its parameters, and how to
write your own. See the documentation,
especially the tutorial, the
advanced user guide, the
technique catalog, and the
recipes.
Contributing
Contributors are always welcome. Feel free to grab an issue to work on or make a suggested improvement. If you wish to contribute, please read the Contribution Guide and Code of Conduct.
Similar Projects

- scikit-learn: its
PipelineandGridSearchCVcombine preprocessing and models and search over hyperparameters.amosuses scikit-learn throughout, and adds named columns, supervised encoders, samplers, comparisons of whole combinations of methods, and settings files. - PyCaret: a low-code library that compares many
models with a few function calls. It automates more choices for you, while
amosasks you to list your methods so that they can be reported. - Kedro: a framework for reproducible data pipelines, with more structure for large, long-running projects.
- MLflow and DVC: track experiments,
data, and models over time. They work well alongside
amos.
License
Use of this repository is authorized under the Apache Software License 2.0.